Formula 1 TQ4.1
AI & Data
Semester programme:Minor Data Driven Business Lab
Project group members:Yavor
Sandra
Mendes
Project description
The Formula 1 project was initiated by two alumni of Fontys University of Applied Sciences and originally developed during their studies. The project is centered around a professional racing simulator located in TQ4.1 at Fontys, which serves as a platform for data-driven performance analysis and experimentation.
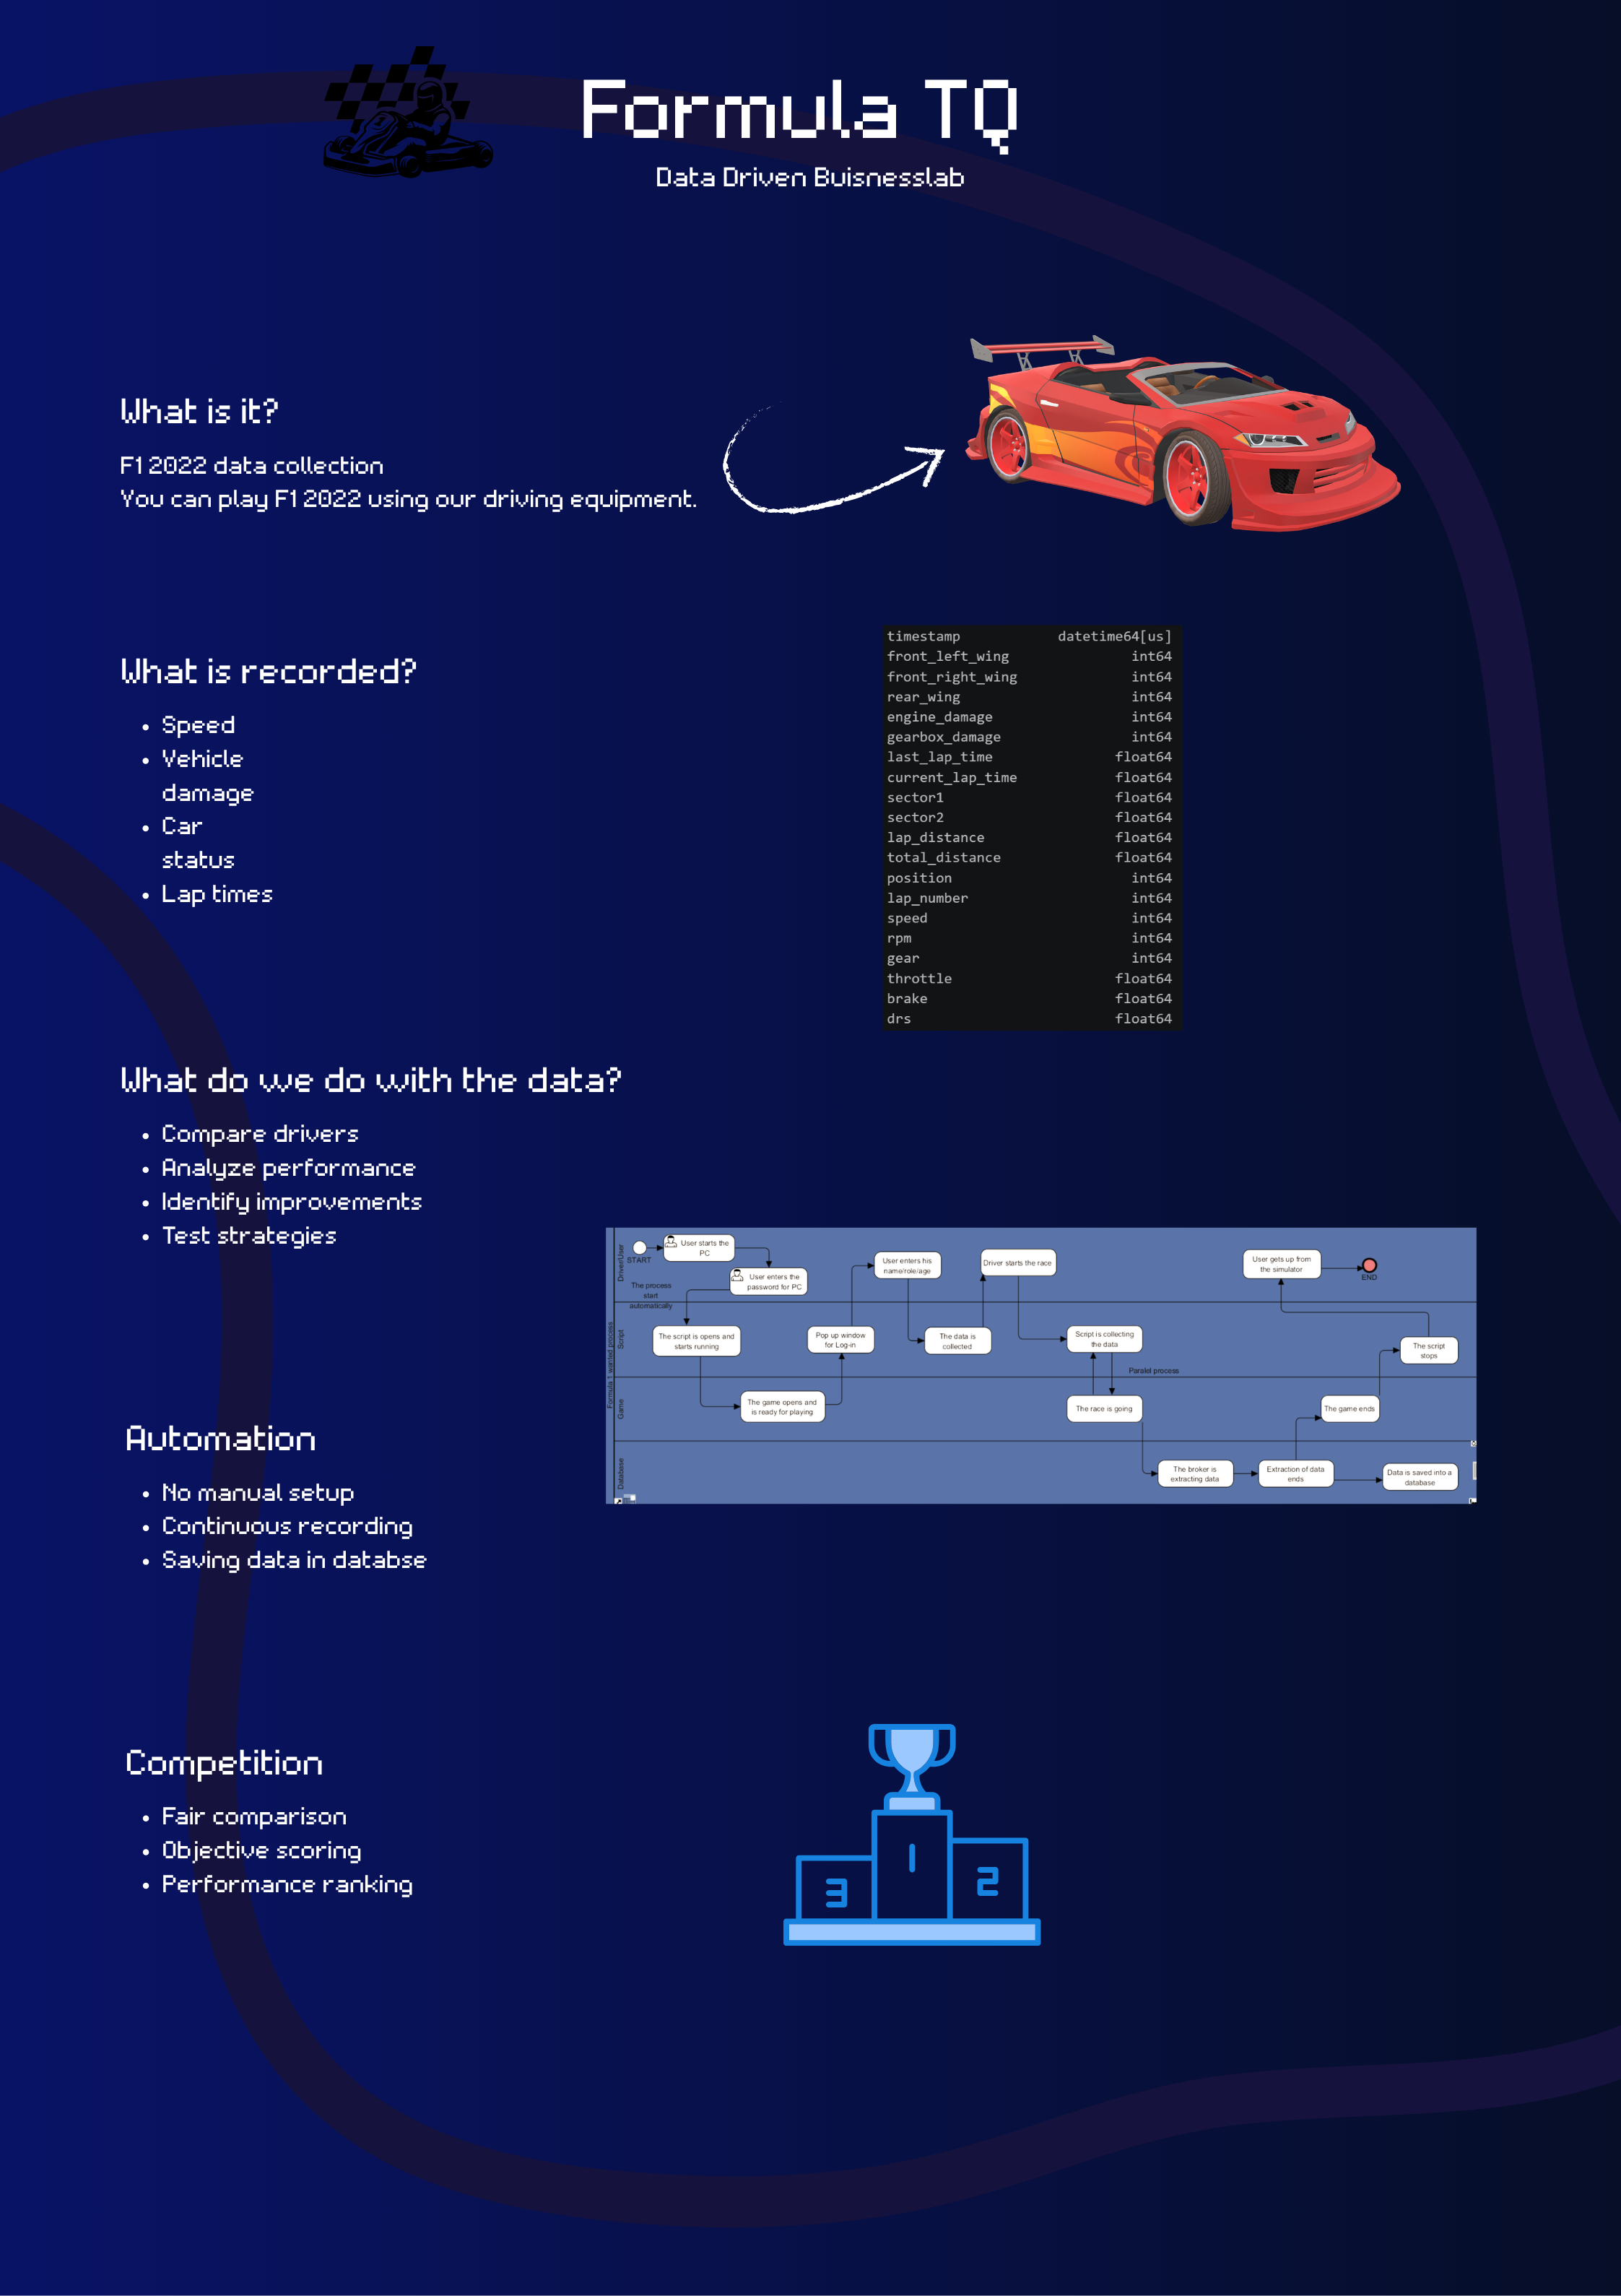
The simulator operates using a predefined software program that enables connection to the system and facilitates the extraction of performance data. This program connects directly to the racing simulator and allows users involved in the project to record telemetry data during their driving sessions. The simulator can be used by students, researchers, and other project participants for educational and analytical purposes.
For every completed lap, the system extracts detailed telemetry data, including lap times, speed, and other relevant performance metrics. This data is automatically stored on a connected computer, ensuring that each session is recorded consistently and accurately. Data needs to be collected by the group, and this is done by playing on the simulator.
Context
People drive the simulator at TQ4.1 and their performance is created, then compared with others and displayed in a leaderboard.
Results
We implemented multiple new features and also changed the codebase quite extensively. First we started with solving previous bugs that did not allow the application to run. Once the application was running, we went ahead and conducted research on what database suits our needs. You will find the in depth research in our research document, however, to make it short here we decided on using SQLite, an extremely beginner friendly and lightweight SQL database. This is due to the nature of the DDBL semester, as we have colleagues from all over the world with incredibly diverse backgrounds, which are rarely technical, but also another very good reason being that this is not supposed to be a highly scalable complex project, it is a fun project for a very limited amount of users at TQ.
After implementing the database we went ahead and got started on the dashboard. We used python for it, using a library called Streamlit. After implementing the initial version of the dashboard we concluded that we needed to extract more data for the leaderboard functionality and also the other graphs we were working on, which included:
- Track ID
- World positions such as X,Y,Z
- Session start and end detection
The dashboard contains of 4 separate tabs.
On the first tab there is the leaderboard on the left part and on the right part next to it there is additional information such as total races, average lap time, last time driven. There are two filters on this page, one is for the track the other is for the driver. When the track is chosen the leaderboard updates based on the track, then when a race is chosen from the other filter the additional details are updated. This is to check for example the first driver how often he/she drives.
